Ulam Spiral
In research, one way to gain insight is to be creative about how you visualize your data. This is central in being able to visualize datasets as diverse as genome sequences or gene expression patterns. This can even showcase interesting properties of something as fundamental as numbers.
One creative visualization of numbers is called the Ulam Spiral. The procedure starts with placing 1 in the center of an arbitrary grid and as the numbers increase you arrange them in a spiraling pattern. Below you can see the result of a function that generates such a spiral as a two-dimensional numpy array.
array([[ 73,  74,  75,  76,  77,  78,  79,  80,  81,  82],
       [ 72,  43,  44,  45,  46,  47,  48,  49,  50,  83],
       [ 71,  42,  21,  22,  23,  24,  25,  26,  51,  84],
       [ 70,  41,  20,   7,   8,   9,  10,  27,  52,  85],
       [ 69,  40,  19,   6,   1,   2,  11,  28,  53,  86],
       [ 68,  39,  18,   5,   4,   3,  12,  29,  54,  87],
       [ 67,  38,  17,  16,  15,  14,  13,  30,  55,  88],
       [ 66,  37,  36,  35,  34,  33,  32,  31,  56,  89],
       [ 65,  64,  63,  62,  61,  60,  59,  58,  57,  90],
       [100,  99,  98,  97,  96,  95,  94,  93,  92,  91]])
The spiral depiction itself is not that interesting - but what occurs after we color cells of the spiral by whether they are prime or not is quite interesting.
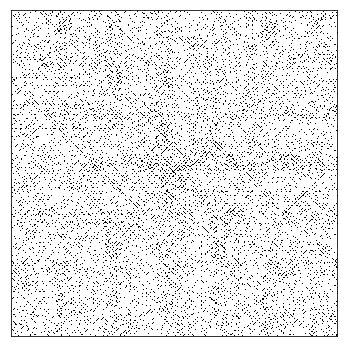
Ulam spiral of size 500 x 500
We can see that there are some diagonal lines that appear quite consistently. Note that the way I have constructed the spiral is such that it goes clockwise as the numbers ascend - as opposed to the diagrams on wikipedia that go counter clockwise. Regardless, the appearance of these diagonal lines are interesting because they suggest that there may be a consistent pattern that dictates the presence of prime numbers, a longstanding problem in number theory. Prime numbers are also central to many of our underlying computer security systems, forming a critical component of modern cryptography.
In addition, we can further visualize not only whether a number is prime or not but the number of divisors that each number in the spiral has. This quickly gets high as numbers get larger, therefore we will plot the log of the number of divisors as the heat.
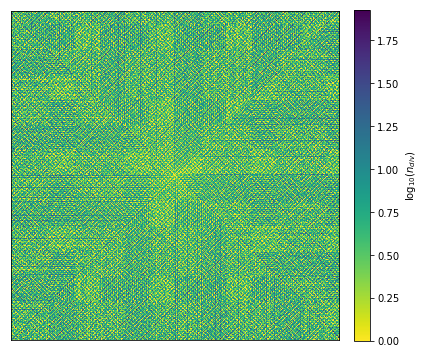
Ulam spiral of size 500 x 500 (colored by log of the number of divisors)
To recreate the figures in this post you can download or use the code from this ipython notebook